Driving Quality Report
This report contains summary information about violations of a particular object.
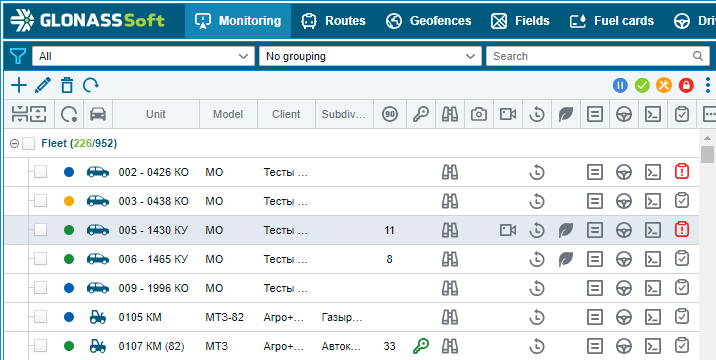
In order to build this report, go to the "Monitoring" section, select the required object and click on the icon  in the "Driving quality" column:
After that, a calendar will open in front of you, with the help of which you need to select the report period. The rendered report looks like this:
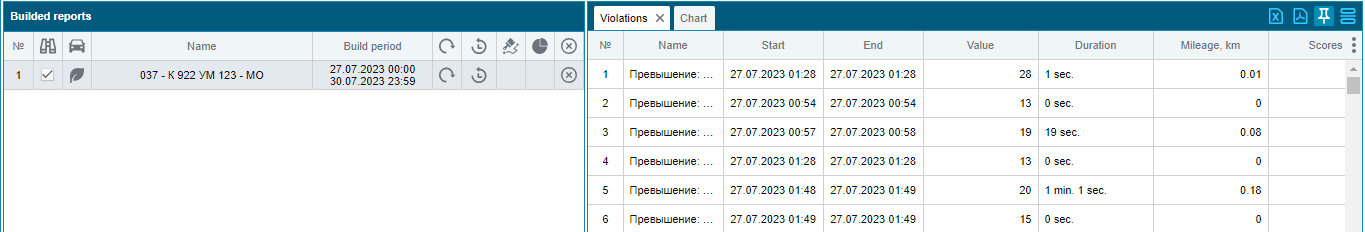
The table consists of the following columns:
Name - the name of the violation.
Start - the date and time the violation started.
End - date and time when the violation ended.
Value - the value by which the minimum value specified in the violation was exceeded. For example, the minimum overspeed value is specified as 10 km/h. The object exceeded by 15 km/h. This means that the difference between them will be displayed, that is, 5.
Duration - the duration of the violation.
Mileage, km - the distance traveled by the object during the period of the violation.
Points - the number of penalty points indicated for this violation.
Start address - the address of the beginning of the violation.
End address - the address of the end of the violation.
Schedule
Also in this report there is a "Graph" tab, which displays a bar graph of the number of penalty points for a flight and a graph of the object's speed.
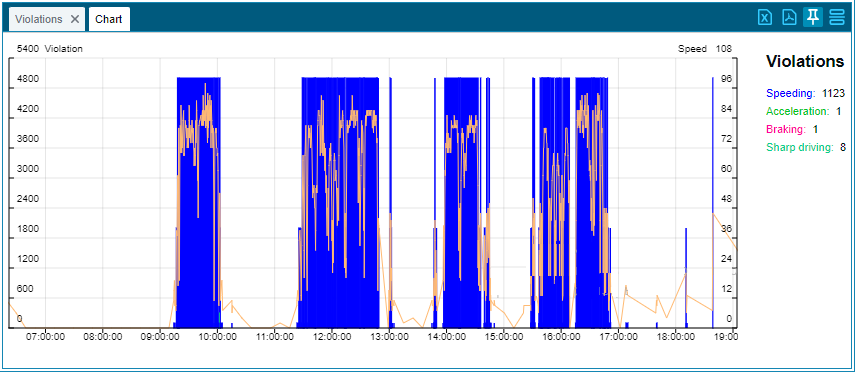
Hovering over a column displays a tooltip with the following content:
At the top right, the period of the flight is indicated in the form of the date and time of the start and end of the flight.
Below are the violations committed for the flight and in what quantity.
Then comes the flight information: Mileage, Time in motion and Max. speed.
On the right side of the graph, the totals for the number of violations committed for the entire period are displayed:
Display on the map
After building the report, the object track for the selected period appears on the map. The places where violations have occurred are also marked. Violations are numbered in the order in which they appear in the table of violations.
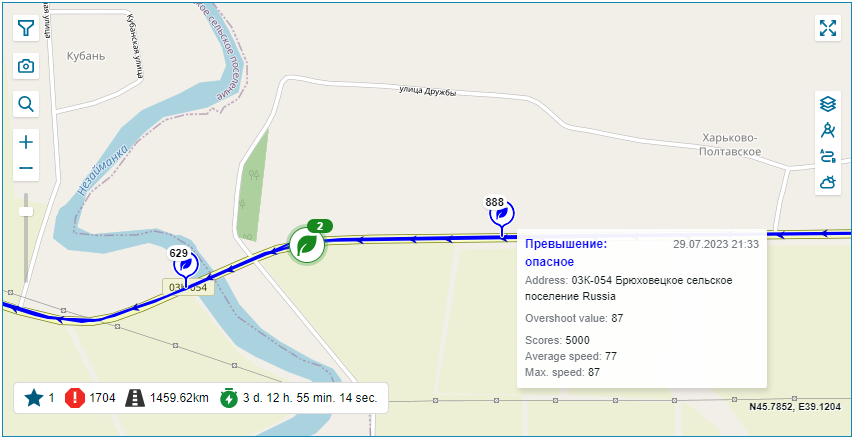
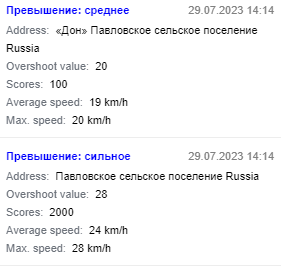
When you hover over the label, a tooltip is displayed that contains:
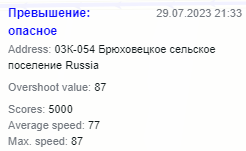
Name of the violation
Date and time of the violation - date and time of the beginning of the violation
Address - the address of the beginning of the violation.
Excess value - the value by which the minimum value specified in the violation was exceeded.
In the lower left corner of the map, there is a general statistics of violations: the driver's rating for the entire selected period; the number of points scored.
This report can be downloaded in excel and pdf by clicking on the corresponding icons in the toolbar.