Ecodriving
The "Driving Quality" module is designed to analyze and receive reports on violations based on the data of the sensors installed on the vehicle and the values obtained from the Ecodriving parameters of the terminal.
In order to go to the module, you must click on the dwarf menu icon -  , and select "Driving quality" from the drop-down list.
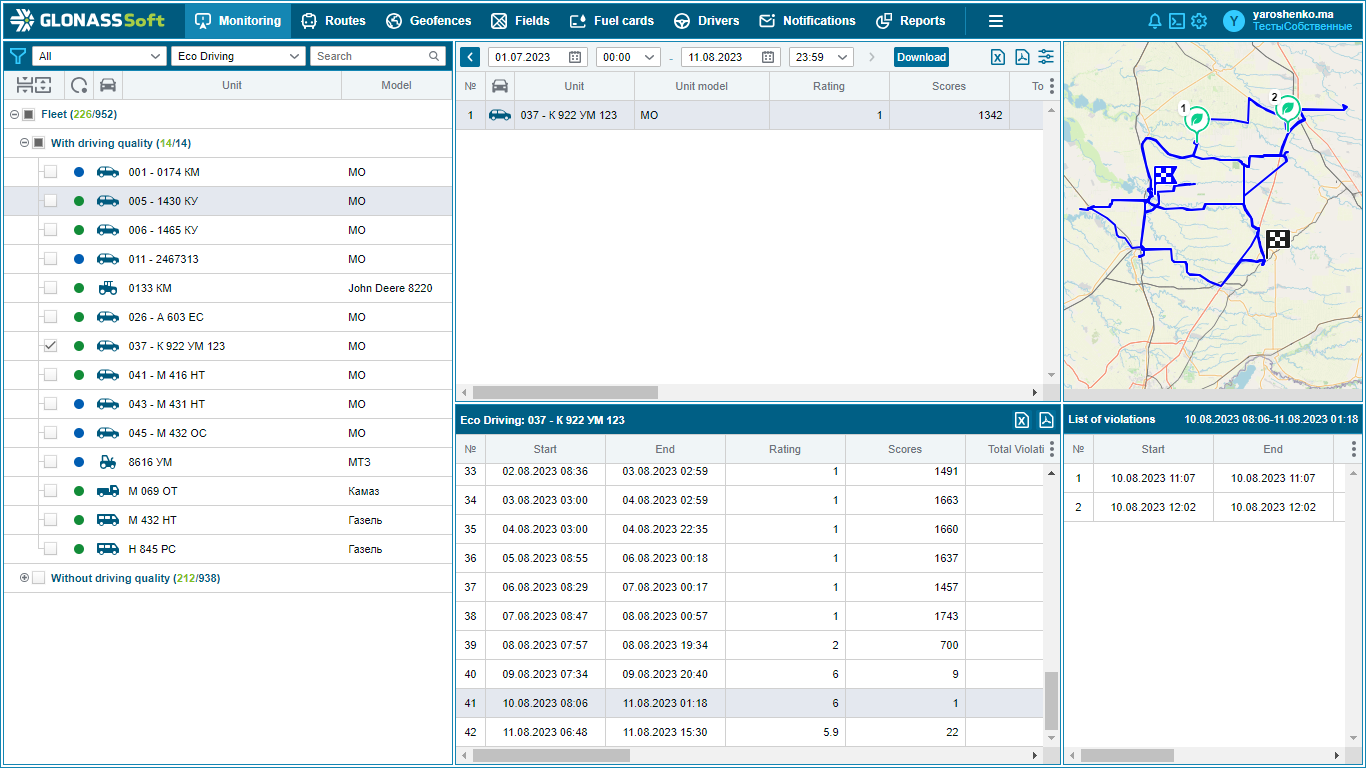
The window of this module consists of 5 parts: List of objects, Rating of driving quality of objects, Driving quality in flights, Map, List of violations.
Object driving quality rating
The rating table displays a summary of driving quality for the selected period.
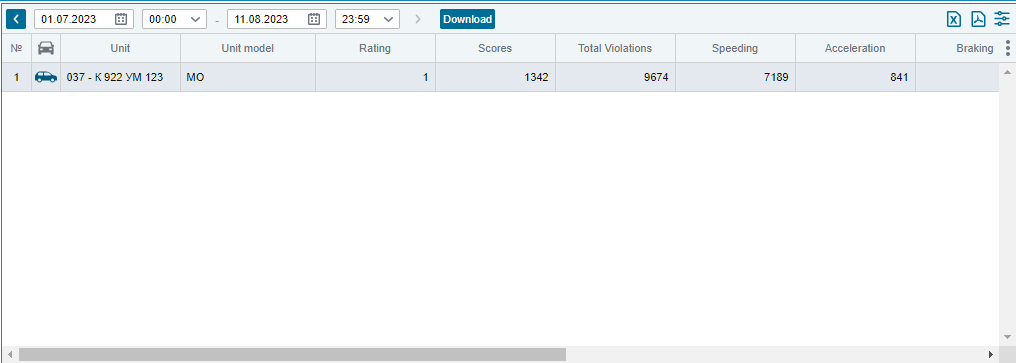
To do this, select an object from the list, then select a period in the toolbar and click the Load button to load the data on the selected objects into the table.
The following information is displayed for the selected objects in the table:
Icon - object icon.
Object - the name of the object.
Object model - object model.
Score - calculated score.
Points - the number of penalty points received for the selected period, taking into account averaging.
Total violations - the total number of violations for the period.
Excess speed - number of violations with the criterion of speeding, km/h.
Acceleration - the number of violations with the criterion Acceleration, g.
Braking - the number of violations with the criterion Braking, g.
Sharp turn - the number of violations with the Turn criterion, g.
Sharp driving - the number of violations with the criterion Abrupt driving, g.
By sensor - the number of violations with the criterion Custom sensor.
Time in motion - total time in motion for the period.
Mileage - total mileage for the period.
Flights - the total number of flights for the period.
You also have the ability to export this table to excel and pdf by clicking on the corresponding icons in the toolbar.
Flight driving quality
This window displays the driving quality rating broken down by flights:
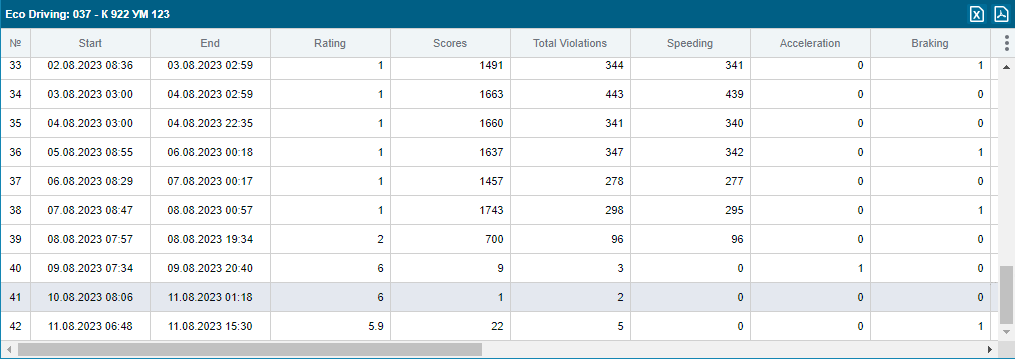
When you click on a row in the "Rating" table, the "Quality of driving in flights" table displays all the object's flights for the period selected in the rating.
The table consists of the following columns:
Start - date and time of the start of the flight.
End - date and time of the end of the trip.
Points - the number of penalty points for the flight, taking into account averaging.
Rating - calculated rating for the flight.
Total violations - the total number of violations per flight.
Excess speed - total number of violations with the criterion of speeding, km/h.
Acceleration - the number of violations with the criterion Acceleration, g.
Braking - the number of violations with the criterion Braking, g.
Sharp turn - the number of violations with the Turn criterion, g.
Sharp driving - the number of violations with the criterion Abrupt driving, g.
By sensor - the number of violations with the criterion Arbitrary sensor.
Time in motion - time spent in motion during the voyage.
Mileage - mileage in flight.
Engine hours - the number of engine hours per trip.
Max. speed - the maximum speed in the flight.
Start address - the address of the start of the flight.
End address - the address of the end of the flight.
Driver - the driver assigned to the vehicle during the flight.
It is also possible to export this table to excel and pdf by clicking on the corresponding icons in the toolbar. The unloaded table displays data within the columns that were selected by the user.
When exporting, the file contains:
1. Driving quality table .
2. Table List of violations , with a list of violations of all flights of the object for the selected period.
List of violations
The "List of violations" table is a table with a list of violations for a trip.
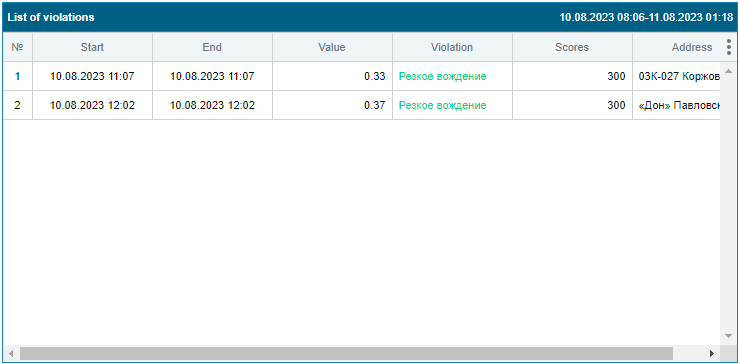
In the "Quality of driving in trips" table, you need to select a row, after which all violations for the trip will appear in the "List of violations" table.
The table consists of the following columns:
Start - the date and time the violation started.
End - date and time of the end of the violation.
Value - the value by which the minimum value specified in the violation was exceeded.
Violation - the name of the violation.
Points - the number of penalty points for this violation.
Start address - the address of the beginning of the violation.
End address - the address of the end of the violation.
By clicking on the line with a violation on the map, the red line will mark that part of the track that was passed with a violation.
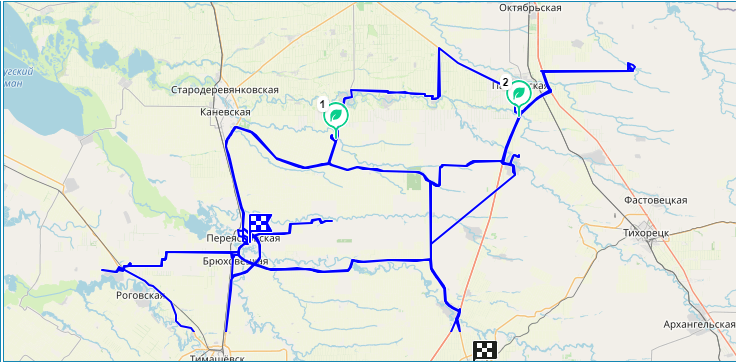
Map
When you select a flight in the "Quality of driving in flights" table, the track of this flight is displayed on the map. When multiple flights are selected, all their tracks are displayed.
When you select a flight in the "Quality of driving in flights" table, the track of this flight is displayed on the map. When multiple flights are selected, all their tracks are displayed.
The map shows the places where violations occurred - 
The violations are numbered in the order in which they appear in the "List of violations" table. They also change color depending on the type of violation.
When you hover over the violation icon on the map, a tooltip is displayed that contains:
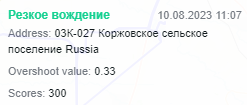
Violation name
Date and time Violation
address Excess value - the value by which the minimum value specified in the violation was exceeded.